Kid Mapping
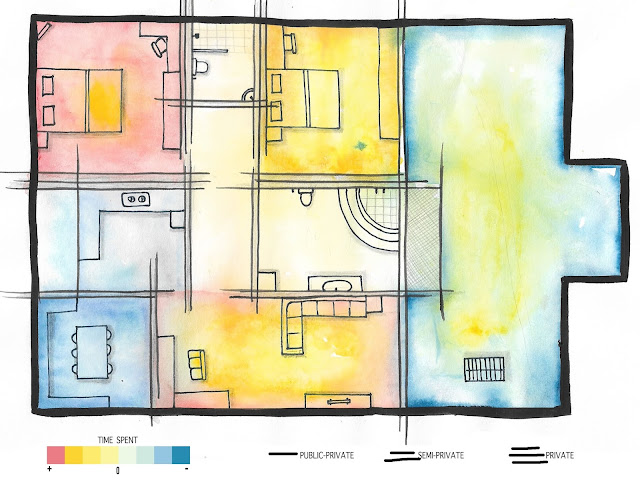
The past 3-4 months have been crucial for everybody staying home, but mostly the kids who had a hard time staying home and not enjoying their vacations or their day of the school. In the following plan of my aunt's house, I mapped the average amount of time spent by my 4-year-old brother in each room around the house. This mapping shows his time spent in a day and the safety threshold.
The colours signify the amount of time spent, red being the highest and blue being the lowest, yellow is mediocre. His daily activities included, the meal timing, watch tv, studying for an hour, playing, etc. The lines dividing the rooms which act as walls are basically the thresholds of the place according to safety. The deeper we go into the home the privacy increases, similarly, the living room is the first room which comes in contact with the outsiders, rather than the bedroom.
Muskaan Mansuri


Comments
Post a Comment